Physical Address
304 North Cardinal St.
Dorchester Center, MA 02124
Physical Address
304 North Cardinal St.
Dorchester Center, MA 02124


There is a story circulating in energy circles that goes roughly like this. The Middle East is on fire, crude is in the high eighties after touching triple digits, the Strait of Hormuz has been throttled for months, and the obvious escape hatch is sitting right there in plain sight. Solar modules cost nine cents a watt. Sodium-ion batteries just entered mass production. Surely, if the crisis grinds on for another year or two, the world simply routes around the barrel.
There is a story circulating in energy circles that goes roughly like this. The Middle East is on fire, crude is in the high eighties after touching triple digits, the Strait of Hormuz has been throttled for months, and the obvious escape hatch is sitting right there in plain sight. Solar modules cost nine cents a watt. Sodium-ion batteries just entered mass production. Surely, if the crisis grinds on for another year or two, the world simply routes around the barrel.
It is an appealing story. It is also arithmetically impossible, and the way in which it fails tells you far more about where capital should go than the story itself ever could.
Start with the least intuitive fact in the entire debate. Oil accounts for roughly 2.6% of global electricity generation. Solar panels make electricity. The overlap between what solar produces and what oil is actually used for is, at the point of direct competition, close to a rounding error.
This is why BloombergNEF’s lead solar analyst spent a chunk of her SNEC presentation in Shanghai this June explaining why two simultaneous energy wars have had remarkably limited effect on solar deployment. Oil and solar are not substitutes in any meaningful near-term sense. They occupy different parts of the energy system entirely.
Where does oil actually go? Road transport takes close to half. Petrochemical feedstock is now the dominant source of demand growth, on track to represent more than 60% of incremental consumption. Aviation and marine bunker fuel take another meaningful slice. Power generation is the smallest piece of the pie, and it is concentrated in exactly the places currently being bombed.
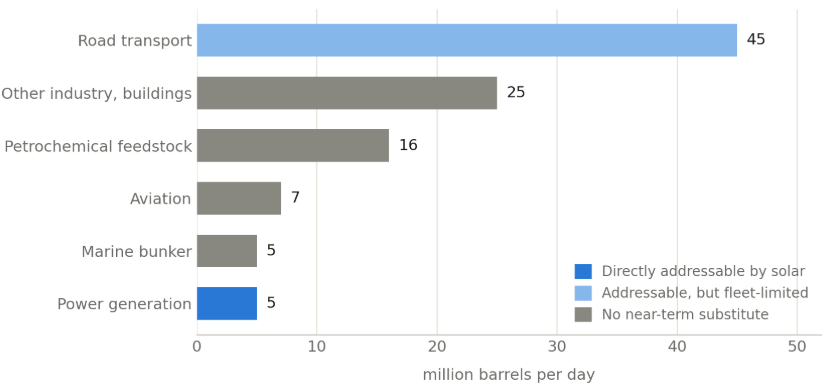
Figure 1: Global oil demand by sector, roughly 104 mb/d. Only power generation — the smallest slice — competes directly with solar. Road transport is theoretically addressable but gated by fleet turnover. Sector splits are approximate and consistent with IEA reporting.
A solar panel cannot make polyethylene. It cannot fly a widebody from Doha to Singapore. It cannot push a Panamax across the Pacific. For the majority of the barrel, there is no substitution mechanism at any price, on any timeline, with any technology currently in existence.
For the portion that can theoretically be electrified — road transport — the arithmetic is worth doing explicitly, because almost nobody does it.
BNEF’s own Electric Vehicle Outlook puts the electricity requirement for a fully electric global road fleet at roughly 8,313 TWh per year. That figure already bakes in the efficiency advantage of electric drivetrains, which is real and large: an electric motor does roughly three to four times more useful work per unit of energy than an internal combustion engine.
Convert that to solar capacity at realistic capacity factors and you need somewhere in the region of 5 terawatts of panels, dedicated exclusively to moving vehicles.
Cumulative global solar capacity just crossed 3 TW. That took about a quarter of a century. The world will install roughly 640 GW this year. So you would need close to eight years of the entire planet’s solar manufacturing output, every panel, diverted to nothing but road transport — and that assumes the vehicles, the grid connections, the charging infrastructure and the storage all already exist.
They do not.
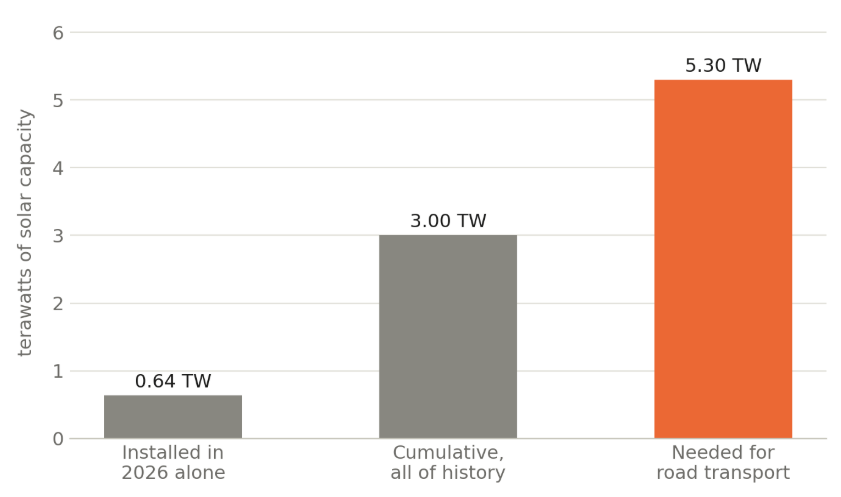
Figure 2: Solar capacity required to electrify global road transport versus what exists. The middle bar took twenty-five years to build; the right-hand bar covers road transport only. Conversion from BNEF’s 8,313 TWh figure assumes a roughly 18% capacity factor — a different assumption moves the estimate materially, and the point survives either way.
The global light vehicle fleet numbers roughly 1.5 billion units. Annual new vehicle sales run around 90 million. Electric vehicles hit a record 20 million-plus sales in 2025, taking a 25% share of the new car market.
Now do the division. Even at that record pace, about 5% of the global car stock is currently electrified. Every new EV sold replaces roughly one-fifteenth of one vehicle’s lifetime consumption, because the car it displaces does not vanish — it gets resold, exported, and driven for another decade somewhere with cheaper fuel and looser standards.
The result is that the entire global EV fleet, accumulated over fifteen years of effort and hundreds of billions in subsidy, displaced about 1.7 million barrels per day in 2025. Against global demand of roughly 104 mb/d, that is 1.6%. The IEA expects that figure to roughly triple to around 5 mb/d by 2030 — a genuinely impressive trajectory that still leaves oil demand near its all-time high at the end of the decade.
Compress that into the one-to-two-year window and you get, generously, another 0.5 to 1.0 mb/d of incremental displacement. Under one percent of global demand. Double it with emergency wartime policy and you reach two percent.
That is not “replacing a substantial part of oil demand.” That is a rounding adjustment.
The sodium-ion narrative deserves specific attention because it is being loaded with expectations it cannot carry.
The technology is genuinely arriving. CATL and Changan unveiled the first mass-production sodium-ion passenger vehicle in February, reaching market by mid-year, with Naxtra cells hitting 175 Wh/kg and pack ranges beyond 400 km. The economics have flipped in sodium’s favour precisely because lithium carbonate has roughly tripled from its 2025 lows, driven by Chinese mine licence freezes, Zimbabwe’s abrupt export suspension in February, and analyst consensus flipping from surplus to deficit.
So sodium is having its moment. But consider the scale honestly. Global sodium-ion production sits at roughly 70 GWh of capacity, against actual output below 5 GWh in 2025. Benchmark Mineral Intelligence, one of the more sober voices, caps sodium’s realistic ceiling at around 15.5% of the battery market within a decade. Wood Mackenzie does not expect cost parity with lithium iron phosphate until roughly 2035.
For context on what those numbers mean: the world will add roughly 459 GWh of grid battery storage in 2026 alone. Sodium is currently a low-single-digit percentage of the battery world.
And here is the detail that should reframe the whole discussion. BNEF’s Jenny Chase pointed out that all 459 GWh of batteries being installed globally this year can store approximately 43 minutes of peak output from the 640 GW of solar being installed the same year. Storage is growing 41% annually and is nowhere close to solving intermittency at the scale required to back out dispatchable fuel.
Sodium-ion is a cost-and-supply-chain story for stationary storage and cheap urban EVs. It is not, on any two-year horizon, an oil story.
Here is the fact that breaks the intuitive model most cleanly.
2026 is on track to be the first annual decline in global solar installations in roughly two decades. Not because of the war — because of Chinese policy. Beijing’s shift from guaranteed pricing to competitive auctions, combined with the latest five-year plan, is pulling Chinese additions down from around 372 GW to roughly 341 GW. Non-China deployment is rising above 300 GW, but not enough to compensate.
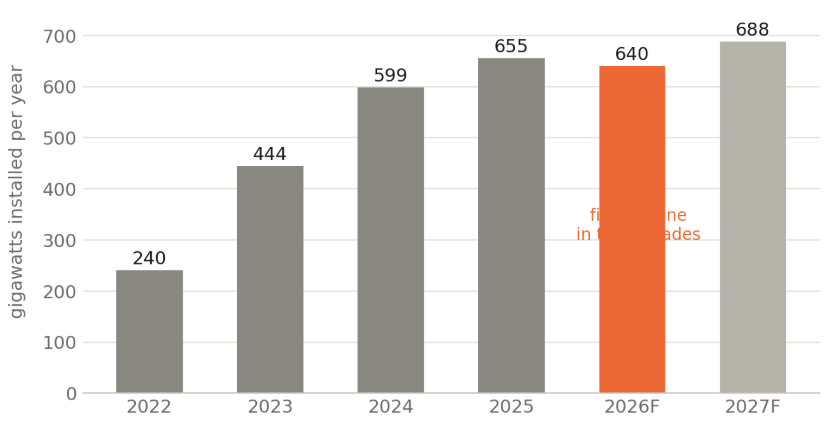
Figure 3: Global annual solar installations. 2026 marks the first decline in roughly two decades — during the worst oil shock since the 1970s. Figures for 2026 and 2027 are BNEF forecasts; earlier years are approximate.
The worst oil shock since the 1970s is running concurrently with a contraction in solar deployment. If your model says energy crisis mechanically equals renewables boom, your model just failed a live test.
The reasons are worth internalising, because they are structural rather than incidental. Solar’s binding constraints are no longer manufacturing or module cost — modules are at nine cents a watt with brutal overcapacity. The constraints are grid interconnection, equipment lead times, and price cannibalisation. Spain logged a record 397 hours of negative power prices in a single quarter this year, more than a third of all daylight hours in the window. When midday power is worthless, the marginal solar project stops penciling regardless of what crude does.
Then there is the physical layer. Lead times for large power transformers now run three to four years, against roughly one year in 2020. High-voltage circuit breakers stretch to around 125 weeks. Medium-voltage switchgear is effectively sold out through 2028. The US interconnection queue has swollen past 2,600 GW with median waits approaching five years, and the American Clean Power Association reported over 6.4 GW of expected Q1 2026 capacity delayed into a growing backlog.
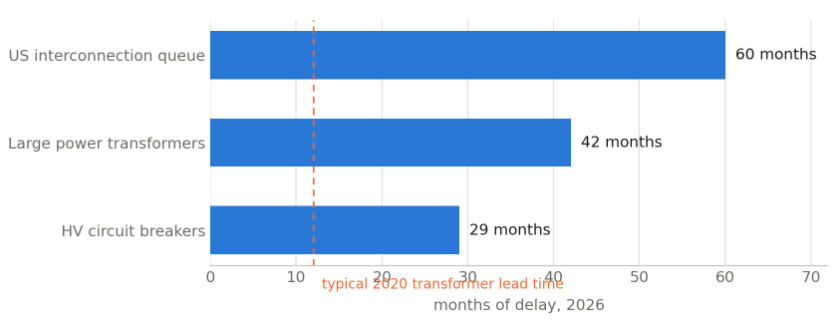
Figure 4: Grid hardware and interconnection delays, 2026 — the constraint no oil price can relieve. Bars are midpoints of reported ranges. A large power transformer took roughly twelve months to procure in 2020.
You cannot panic-buy your way out of a transformer factory. That is the real speed limit, and no amount of oil price does anything about it.
Something is. Global oil demand is now forecast to contract by 420,000 b/d in 2026, some 1.3 mb/d below the pre-war trajectory.
But read the mechanism carefully, because it matters enormously for how you position. The demand is not being substituted. It is being destroyed.
Petrochemical crackers across Asia have slashed operating rates because feedstock stopped arriving. Naphtha consumption in Europe fell almost 20% in a single month as operators pre-empted physical shortages. Jet fuel prices nearly tripled and aviation activity collapsed below normal levels. The IEA’s energy crisis policy tracker catalogues measures from nearly eighty countries — mandatory teleworking, air travel restrictions, suspended government construction, additional public holidays. Members released 400 million barrels from emergency reserves, the largest coordinated action in the agency’s history.
That is rationing, recession and price pain. Every barrel “saved” this way comes back the moment the Strait reopens. Substitution is permanent; demand destruction is a loan against future consumption.
The pessimism above is about aggregate volumes. It is not an argument that nothing happens, and the places where things do happen in twenty-four months are unusually specific and unusually investable.
Gulf crude burn. The single largest pool of oil-fired electricity on earth sits in the countries at the centre of the conflict. Saudi Arabia has burned as much as 1.4 mb/d of liquids in peak summer, and its Liquid Fuels Displacement Programme targets roughly 1 mb/d of domestic oil use by 2030. Progress is genuine — Saudi oil demand fell 130 kb/d in 2025 despite strong cooling demand. The caveat contrarians should note: most of that displacement is gas from Jafurah, not solar. Renewables remain under 1% of Saudi generation.
Diesel gensets and weak grids. This is the fastest substitution channel in existence because it bypasses every bottleneck that matters. No interconnection queue, no transformer, no permitting cycle. IRENA’s April policy advisory specifically flags solar-battery hybrid mini-grids as an immediate-action item. Off-grid and backup diesel is expensive, distributed and replaceable in months rather than years.
Two and three-wheelers. Emerging Asia’s scooter fleet turns over in two to three years, not fifteen. Cheap, cold-tolerant, low-energy-density cells are perfect for this application — which is exactly the segment sodium-ion is built for. This is where battery chemistry and oil displacement genuinely intersect on a short timeline.
Chinese heavy trucking. Electric trucks already account for more than 10% of global EV oil displacement, and gas-fuelled trucking has quietly eaten a meaningful share of Chinese diesel demand.
Here is the reframe that makes the entire analysis actionable.
You do not need to replace a substantial share of 104 mb/d to change the world. Oil is priced on the margin. A two million barrel per day swing is the difference between sixty dollar crude and one hundred and twenty dollar crude. The Saudi displacement programme alone, if fully executed, frees roughly a million barrels a day for export — enough to shift the global balance meaningfully.
So the correct model is not “solar replaces oil.” It is: substitution is volumetrically trivial and strategically decisive at the same time. Both statements are true simultaneously, and almost every piece of commentary on this subject collapses them into one another.
If the analysis above is right, several conventional trades look wrong.
Solar module manufacturers are the wrong expression. Nine cent modules, structural overcapacity, the first demand contraction in twenty years, and negative midday power prices in the best solar markets on earth. The commodity is cheap and getting cheaper. Cheap commodities do not make good equities.
The constraint is the trade. Transformers, switchgear, high-voltage cable and grid engineering have three-to-five-year backlogs and genuine pricing power. Note that Siemens Energy spent this June acquiring transformer monitoring specialist Camlin after expanding its Nuremberg transformer plant. Incumbents are buying into the bottleneck, not the panel.
Storage outgrows generation. Battery deployment is compounding above 40% annually while solar contracts. That divergence is the single clearest trend in the sector.
Distributed beats utility-scale on speed. Anything that avoids the interconnection queue has a structural time-to-market advantage measured in years.
The unsubstitutable barrel has pricing power. Petrochemical feedstock, jet fuel and marine bunker have no near-term alternative at any price. Middle distillate cracks reached all-time highs during this crisis for exactly that reason.
Watch the rates channel. This is the most underappreciated risk to the bullish renewables case. Solar and storage are eighty-plus percent upfront capital expenditure, which makes them extraordinarily sensitive to the cost of capital. An oil shock drives inflation, which keeps central banks on hold, which raises the discount rate on every renewable project globally. The 2022 precedent is instructive: an energy crisis that was supposed to accelerate the transition instead produced a wave of project cancellations as financing costs climbed. High oil prices are not straightforwardly bullish for renewables. They are bullish for renewables in oil-burning power markets and bearish for capital-intensive projects everywhere else.
Intellectual honesty requires stating the falsification conditions, and there are real ones.
If Chinese solar deployment reaccelerates sharply in 2027 rather than stabilising, the “structural slowdown” reading is wrong and this is merely a policy air pocket. If sodium-ion costs fall to the forty dollars per kilowatt-hour that IRENA models at 400 GWh of scale — materially ahead of the 2035 consensus — the storage economics change qualitatively rather than incrementally. If the war produces a genuine 1970s-style policy rupture rather than the eighty-country patchwork of teleworking mandates seen so far, adoption curves can bend faster than fleet-turnover math suggests. The IEA itself notes that unlike the 1970s, the technological and policy foundations now exist for faster reductions in oil consumption than were previously possible. And European EV demand rose 24% year-on-year in April, which BNEF explicitly flagged as the sector’s potential “X factor.”
The bull case is not stupid. It is simply operating on a five-to-fifteen year clock while being marketed on a one-to-two year clock.
Within twelve to twenty-four months, solar and sodium-ion batteries will displace somewhere between half a million and one and a half million barrels per day of global oil demand, concentrated in Gulf power generation, distributed diesel replacement, and small-vehicle electrification in emerging Asia.
That is roughly one percent of global consumption. It is also, given how oil prices actually form, potentially worth twenty dollars a barrel.
Anyone telling you the transition rescues you from this crisis is selling something. Anyone telling you it does not matter has never traded a marginal barrel.