Physical Address
304 North Cardinal St.
Dorchester Center, MA 02124
Physical Address
304 North Cardinal St.
Dorchester Center, MA 02124

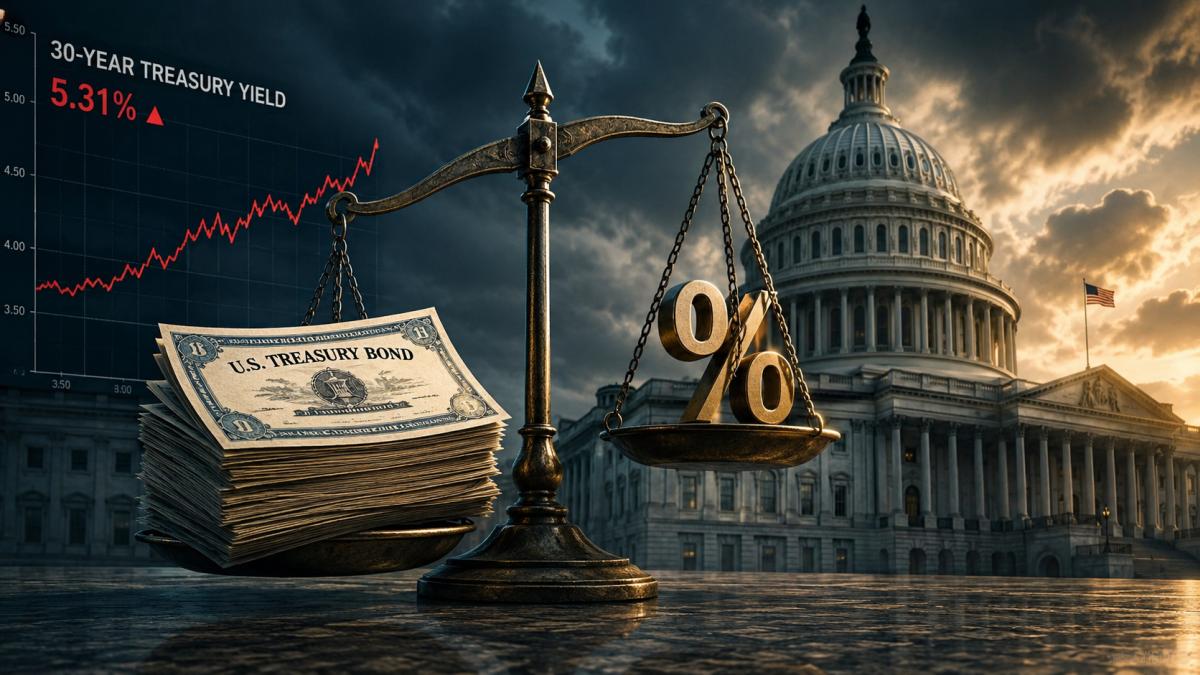
There is a genre of financial content that has learned exactly how to hold your attention. It opens with a real number, layers three plausible-sounding causal steps on top of it, and lands on the collapse of the global monetary order. The current specimen making the rounds combines the $40 trillion debt milestone, the long-bond selloff, and AI capital spending into a single narrative in which the United States is one auction away from insolvency.
There is a genre of financial content that has learned exactly how to hold your attention. It opens with a real number, layers three plausible-sounding causal steps on top of it, and lands on the collapse of the global monetary order. The current specimen making the rounds combines the $40 trillion debt milestone, the long-bond selloff, and AI capital spending into a single narrative in which the United States is one auction away from insolvency.
The frustrating part is that the underlying facts are largely correct. The 30-year Treasury yield really did reach levels last seen before the financial crisis. The debt really did cross $40 trillion. Hyperscalers really are borrowing at unprecedented scale. What breaks is the causal chain connecting them, and the conclusion drawn from it. If you want to make money in this environment rather than doom-scroll through it, the distinction matters enormously.
The precipitating event was the 30-year Treasury yield rising to around 5.31% in mid-August, the highest level since 2007. It briefly touched 5.34% before easing. Worth noting: the 2007 peak was 5.44%. We have not exceeded it. We have approached a nineteen-year-old high, which is a meaningfully different statement than “record crash,” and the difference is not pedantry. It tells you the long end is repricing toward a historically ordinary level rather than breaking into unmapped territory.
This was not an isolated American event. French and German ten-year yields hit their highest levels since 2008 and 2011 respectively, Canadian thirty-year paper reached 2010 levels, and Japanese ten-year yields touched thirty-year highs. When every developed sovereign curve steepens simultaneously, you are not looking at a verdict on one country’s creditworthiness. You are looking at a global repricing of the compensation investors demand for holding long duration in a world of heavy issuance and inflation that has run above target for five consecutive years.
Meanwhile the front of the curve did nothing at all. The Fed has held at 3.50% to 3.75% for five straight meetings. The entire move happened in the part of the curve the central bank does not control, which is precisely where you would expect a term premium story to show up and precisely not where you would expect a credit panic to appear. A market genuinely worried about default prices it in the short end too, because default risk does not politely wait thirty years.
The most viral claim in the doom narrative is that the Treasury has begun buying its own debt because nobody else will, and that this constitutes yield curve control, monetisation, and the endgame of the whole scheme.
Here is the actual operation. The Treasury doubled the maximum size of its long-dated buybacks from $2 billion to at least $4 billion, running through September to November. Against roughly $30 trillion of marketable debt outstanding, that is a rounding error on a rounding error. Buybacks retire illiquid off-the-run securities and are funded by issuing liquid on-the-run paper. Net debt outstanding barely moves. The purpose is to improve liquidity in the least-traded corners of the curve so dealers can make markets without blowing out bid-ask spreads.
Yield curve control is a fundamentally different animal. It requires a central bank, not a treasury, committing to an unlimited standing bid at a specified yield. There is no target. There is no unlimited bid. There is no central bank involvement. Calling a $4 billion liquidity operation the same thing as wartime YCC is like calling a fire drill an evacuation. The tell is that yields fell to 5.19% on the announcement and then resumed climbing, which is exactly what you would expect from a technical liquidity measure and exactly not what you would expect if the government had seized control of the long end.
Gross federal debt crossed $40 trillion. That figure is real, and the pace is genuinely alarming: it took five months to go from $39 trillion, and the CBO had projected this threshold for 2028.
But the gross number includes intragovernmental holdings, the IOUs the government has written to itself, primarily the Social Security trust fund. The measure economists actually use for solvency analysis is debt held by the public, which sits near $31 trillion against a nominal GDP of roughly $32 trillion. The IMF projects gross debt at 125.8% of GDP for 2026, up from 103.7% in 2012.
The claim that 100% debt to GDP is the threshold at which a country becomes fiscally unsustainable is not a finding from economics. It is a number someone made up because it sounds clean. Japan has operated above 200% for over a decade without a funding crisis. The United Kingdom exceeded 250% after the Napoleonic Wars and went on to industrialise the planet. What high debt reliably does is raise the cost of everything else, crowd out discretionary spending, and shrink the fiscal room available when the next genuine shock arrives. Interest costs have now eclipsed both defence and health insurance spending, which is a slow constriction, not a cliff edge.
The claim that Google, Meta and Amazon “ran out of money” is the single most misleading line in the entire narrative. These firms carry credit ratings in the single-A to double-A range and generate cash at a scale almost no industrial company can match. Alphabet has debt-financed roughly 15% of its stated capital expenditure plan. That is not desperation. That is a treasurer noticing that long-dated debt is a cheaper way to fund a long-lived asset than liquidating a balance sheet.
The scale is real though. Hyperscaler issuance ran at roughly $35 billion a year between 2020 and 2024, jumped to $93 billion in 2025, and reached about $132 billion by the end of July this year, including one multi-tranche offering near $53 billion and a rare hundred-year bond. Total AI-related issuance estimates for the full year run from $300 billion to $570 billion.
But the causal arrow in the doom version runs backwards. Corporate issuers do not set Treasury yields. They price off them, at a spread. A flood of high-grade corporate supply competes for the same investor capital and widens spreads, which is a credit story. Treasury supply and inflation expectations drive the government curve, which is a macro story. Conflating the two produces a satisfying narrative and a terrible model.
If you want the genuine risk here, it is not on the balance sheets you can see. S&P has identified roughly $675 billion of signed but not yet commenced lease obligations across the hyperscalers, sitting outside reported funded debt entirely. Marginal financing has migrated to data-centre developers borrowing from private credit funds, insurers and retail-oriented vehicles, where the disclosure is thinner and the mark-to-market discipline is weaker. Analysts have flagged hidden borrowing across the five largest firms running well beyond the visible bond totals, and oversubscription on new deals has fallen sharply from where it sat earlier in the year. That is where a crack would appear first. Not in the debt clock.
The doom narrative asserts headline inflation at 3.8% and wholesale inflation at 6%, with markets pricing a 75% probability of rate hikes. The actual July print showed CPI up 0.1% on the month and 3.4% year over year, with core at 2.5%, both down from June. Producer prices came in flat. Retail sales fell 0.6%. Following the release, futures moved to a 64% probability that the Fed simply holds.
Sticky, energy-driven, above target, and slowly cooling against softening demand is a legitimately uncomfortable position for a central bank. It is not a hyperinflation on-ramp. And note the internal contradiction the panic thesis cannot resolve: it simultaneously argues the Fed is trapped and cannot cut, and that the Fed is about to expand its balance sheet and debase the currency. Both cannot be true. A narrative flexible enough to accommodate both outcomes is not a forecast. It is a mood.
Foreign holdings of Treasuries did decline in the most recent data, led by Japan, the United Kingdom and China. The Treasury’s own major foreign holders table is public and shows the monthly path clearly. It also shows aggregate foreign ownership sitting near record dollar levels. A single month of decline in a series that has trended up for years is not a boycott.
Japan’s selling in particular has a mundane explanation. Tokyo has been defending a currency that fell to forty-year lows, and defending a currency requires dollars. The joint intervention in early August, the first coordinated US-Japan yen-buying operation in decades, was conducted partly in euros specifically so that Japan would not have to liquidate Treasuries to fund it. Read that again. The intervention was designed to reduce Treasury selling. The doom version presents it as evidence of a bailout that increases Treasury selling. The facts are not merely different, they point the opposite direction.
Strip the narrative away and the investable observation is unglamorous. A 30-year Treasury yielding 5.3% against headline inflation of 3.4% offers a real yield approaching two percentage points. The video calls this “a terrible ROI.” It is, in fact, the most compensation long-duration government paper has offered in nineteen years, and the entire history of bond investing says that starting yield is the dominant predictor of forward return.
That does not mean back the truck up. The term premium can widen further, the supply calendar is heavy, and duration hurts on the way there. But the correct posture toward an asset that has repriced to a two-decade high in yield is interest, not terror. The people telling you to exit all markets and buy gold before everything goes to 98% down are describing a scenario in which their advice would also be worthless, which should tell you something about how seriously they hold it.
Watch the things that actually signal stress: auction tails and dealer takedown percentages, the spread on data-centre and hyperscaler paper relative to the broad index, private credit marks, and whether core inflation stops falling. Ignore the debt clock, the collider, and anyone who needs you to be frightened before they can be persuasive.