Physical Address
304 North Cardinal St.
Dorchester Center, MA 02124
Physical Address
304 North Cardinal St.
Dorchester Center, MA 02124


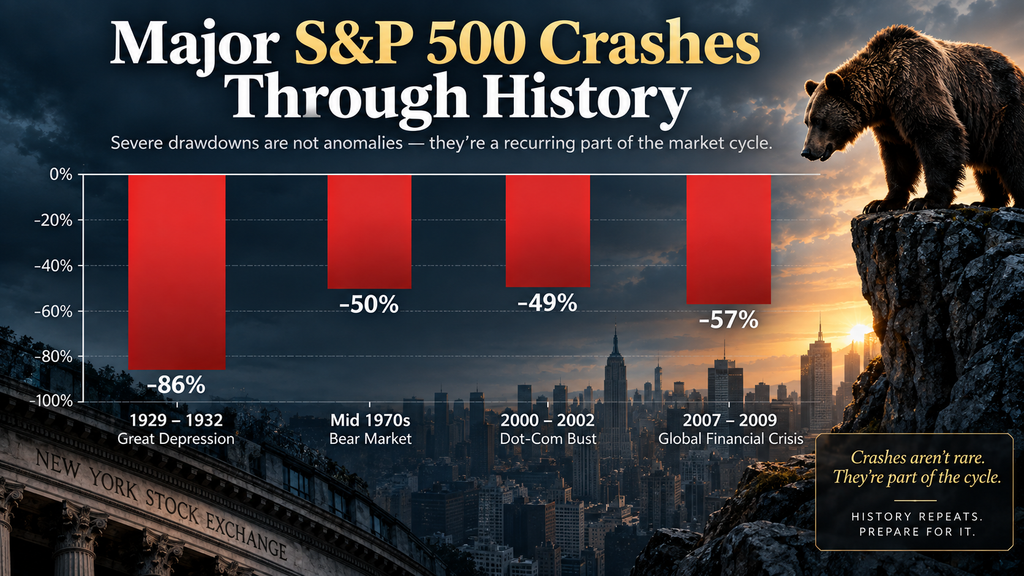
Ask investors what keeps them up at night and the answer is rarely a slow, gentle decline. It is the crash, the sudden, violent, portfolio-halving kind. And the uncomfortable truth is that these events are not rare anomalies. They are a recurring feature of markets. A review of a century of S&P 500 price history makes the pattern impossible to ignore: an 86 percent collapse from the 1929 peak into the depths of the Great Depression, a brutal bear market in the mid 1970s that erased nearly half of index value, a 49 percent plunge in the dot-com bust from 2000 to 2002, and an approximately 57 percent freefall during the global financial crisis from 2007 to 2009. Add the severe bear markets of the late 1930s and early 1940s plus countless 30 percent corrections, and the message is blunt. Roughly every decade or so, markets hand investors a loss of about half their money or worse.
Today, with artificial intelligence stocks dominating index returns and valuations echoing the late 1990s, a growing number of investors suspect the next episode is already being scheduled. Here is the good news. You do not need to predict it. You need a simple mechanical rule that gets you out early, keeps you out during the worst of the damage, and gets you back in before the recovery becomes obvious to everyone. That rule exists, it fits on a single line of a chart, and it takes zero analytical skill to follow.
The default advice from planners, pundits, and textbooks is buy and hold: own a broad index fund, ignore the noise, ride out every storm. The problem with that advice is arithmetic, not philosophy. An investor who bought the S&P 500 at the dot-com peak in 2000 watched the index lose about half its value over the following two and a half years. The price-only recovery did not arrive until late 2007, precisely in time for the financial crisis to erase the progress all over again. Adjusted for inflation, the round trip from the 2000 top stretched to roughly 13 or 14 years. Think about what that means in real life. Money aimed at retirement, a first home, or a child’s tuition simply sat there for more than a decade, treading water.
The reassurance that the market always eventually recovers is true in nominal terms for the broad United States index. But eventually is doing an enormous amount of work in that sentence. Your goals have deadlines, and any approach that requires you to endure a 50 percent loss followed by years of walking in place can quietly break those deadlines.
Skeptics often reply that they avoid equities entirely, preferring gold or bitcoin. Yet hard assets crash too. Gold rolled over after its 2011 peak and spent years in a bear market that cut prices by nearly half at the worst point. Bitcoin is even more dramatic, as bitcoin’s historical drawdowns from all-time highs make painfully clear: repeated cycles of 50 percent, 70 percent, and even 80 percent declines, including multiple halves-in-value within little more than a decade. Buy and hold in any volatile asset carries the same hidden cost, which is long stretches where your capital is merely recovering old ground instead of compounding.
That is why the strategy below is asset agnostic. It works on index funds, on gold, on bitcoin, and on essentially any liquid market capable of sustaining a trend.
The entire system is built on a single indicator, the 200-day simple moving average, which is nothing more exotic than the average of the last 200 daily closing prices plotted as a smooth line over your price chart. It is one of the oldest and most widely watched trend filters in all of finance.
Rule one, the exit signal: when price closes below the 200-day average and that average itself has begun sloping downward, you sell. You are not guessing that a crash is coming. You are simply acknowledging that the long-term trend has already turned down and refusing to keep funding it.
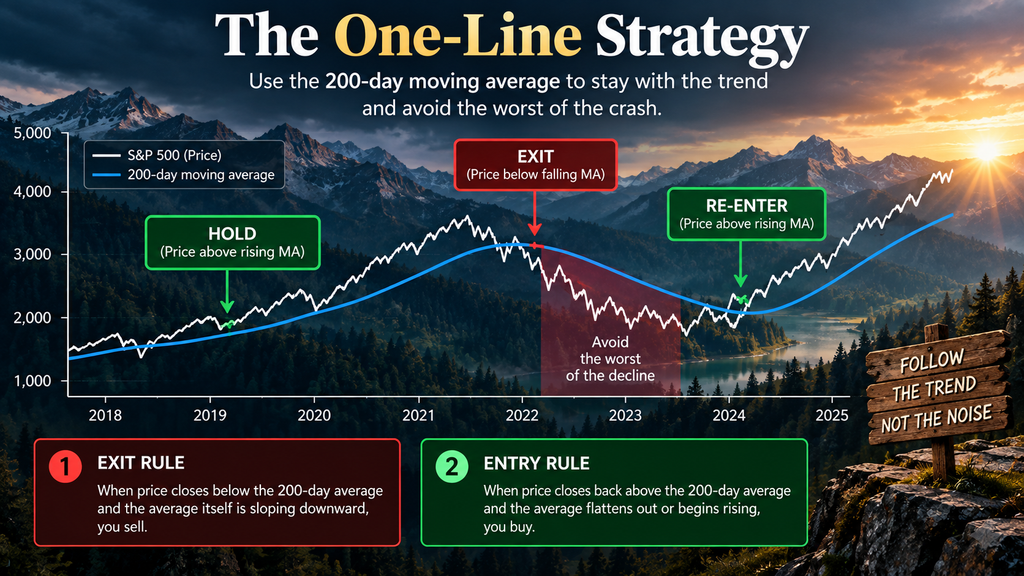
Rule two, the entry signal: when price closes back above the 200-day average and that average flattens out or begins rising, you buy. The trend has resumed and you rejoin it.
Between those two signals you do nothing at all. You hold positions while the trend is up. You hold cash or short-term treasuries while the trend is down. That is the whole system.
Readers familiar with classic trend following will recognize close relatives here, namely the golden cross and death cross, where a shorter-term average crossing above or below a longer-term average marks the turn of the cycle. The price-versus-200-day version used here is even simpler because it requires only one line on the chart plus a glance at whether that line is rising or falling. The slope condition is the secret sauce. It filters out the brief head-fake dips below the average that occur inside healthy bull markets, keeping you invested through normal volatility while still getting you out when real damage begins.
Run the rule on the S&P 500, using the SPY ETF as a proxy, starting in the summer of 2000. Price trades below the falling 200-day line by that autumn, handing you an exit in the low $140s, well before the ensuing slide lopped nearly half off the index. Then in mid 2003, price reclaims the average just as it flattens and turns up, putting you back in around the $90s. From there you stay seated for the full advance of 2003 to 2007, back above $140 and ultimately to new highs. You skipped most of a 49 percent bear market and then captured most of the bull market that followed it.
Fast forward to 2007 and 2009 and the same mechanics repeat: an exit in late 2007 as the average rolls over, a re-entry in mid 2009 as it turns up, and a skip over the worst financial crisis in eight decades.
Gold tells the identical story. The exit signal fires in early 2013 as gold breaks below its falling 200-day line, sparing you the multi-year slide that followed. Re-entry arrives only when a genuine new uptrend begins, and from there the rule keeps you seated for the powerful gold bull market running from 2023 into 2026, a move that carried the GLD ETF from roughly $180 to well above $400.
Bitcoin compresses the timeline but not the logic. The rule exits in early 2022 before that year’s devastating slide, and re-enters in early 2023 in time for the explosive advance of 2023 to 2025. An asset famous for punishing sleeping holders with 70 percent drawdowns becomes, under this filter, a ride you only take while it is actually moving upward.
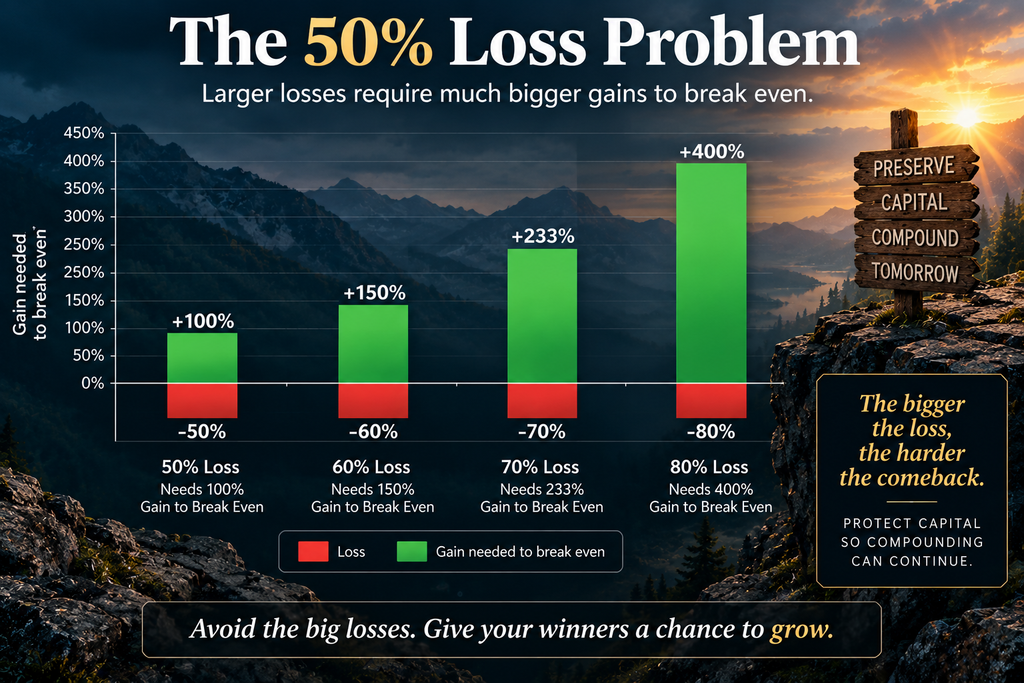
Here is the point most people miss. The profits are a byproduct. The primary job of the strategy is refusing the catastrophic loss, because avoiding a 50 percent loss means you never need a 100 percent gain just to get back to even. Compounding only works on money you did not lose.
No mechanical rule is magic, and anyone selling certainty is selling something else. Trend following pays for its crash protection with whipsaws: in choppy sideways markets the rule will occasionally exit and re-enter at a small loss. Those small losses are the premium on an insurance policy, and they are deliberately boring compared with the disasters they help you skip.
You will also never sell the exact top or buy the exact bottom. A 200-day line is a lagging indicator by design, and the goal is the fat middle of every move, the majority of the trend, not the perfect tick.
Practical details matter as well. Judge the signal on closing prices, checked daily or weekly, never on intraday noise. Mind taxes in taxable accounts because exits can trigger capital gains. Park exited capital somewhere productive, such as a money market fund or treasury bills, so your defense still earns a yield. And write your rules down in advance, because the hard part of this strategy has never been the calculation. It is the discipline to follow a simple line while headlines and emotions scream at you to do the opposite.
Open a free charting platform, pull up the assets you actually own, whether that is a broad index ETF, a gold ETF, or bitcoin, and overlay the 200-day simple moving average. Look at exactly two things: is price above or below the line, and is the line rising or falling. Set an alert near the line so you never have to remember to check. Then write your personal rule card: exit on a close below a falling average, re-enter on a close above a flattening or rising average, and do nothing in between.
Crashes of 50 percent or more are not a possibility to fear. They are a historical certainty to prepare for, again and again, and the investors who own the recoveries are the ones who survived the collapses with their capital intact. One line on a chart, two simple rules, and the patience to follow them: that is the entire edge.
This article is for educational purposes only and is not personalized investment advice. No indicator or rule guarantees future results.