Physical Address
304 North Cardinal St.
Dorchester Center, MA 02124
Physical Address
304 North Cardinal St.
Dorchester Center, MA 02124


Bitcoin trades below its full production cost while gold sits at twice its mining cost. History shows why Bitcoin's cost line moves to meet the price, not the other way round.
Bitcoin is changing hands at roughly $64,000 to $65,000 this week. By most full-cost estimates, that is less than it costs the average miner to produce a single coin. Gold, meanwhile, trades at around twice what it costs the typical mine to pull an ounce out of the ground. Two assets that are constantly compared with each other, and they sit in completely different places relative to their cost lines.
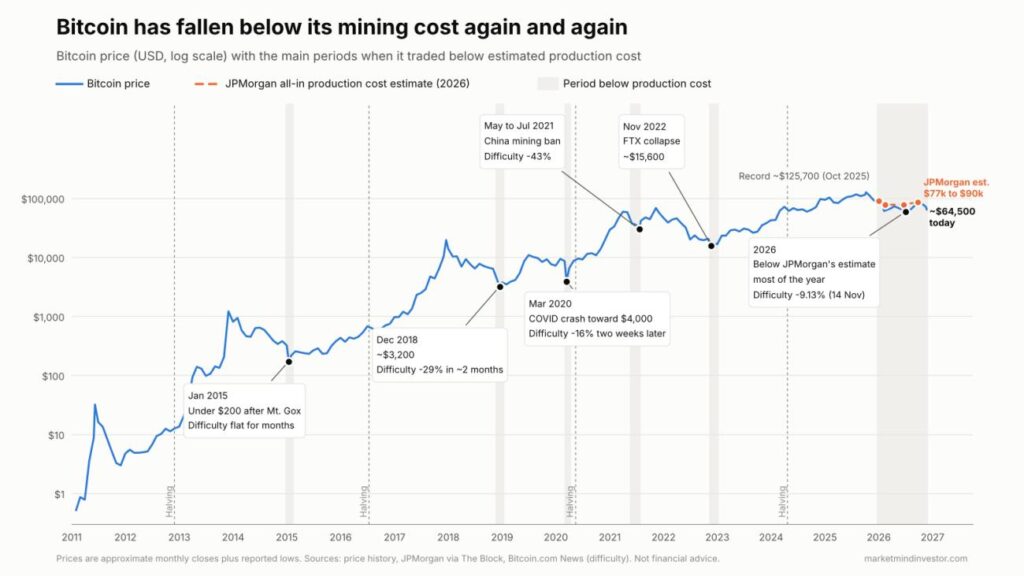
The popular reading is that a price below the Bitcoin mining cost acts as a floor. Miners will not sell at a loss, the argument goes, so the price has to bounce. Bitcoin’s history tells a more interesting story. Its cost line does not hold the price up. It moves down to meet it. Understanding why is worth more than any single price target, and it changes how you should read the “below cost” headlines doing the rounds right now.
For its first nine months, Bitcoin had no dollar value at all. The network went live in January 2009 and nobody was swapping the coins for cash. That changed on 5 October 2009, when an early user going by NewLibertyStandard published a rate of 1,309.03 BTC to the US dollar. There was no trading behind the number. As this history of the earliest Bitcoin exchanges explains, he worked out what it cost in electricity to run a high-CPU computer, factored in the average US household power price, and divided by the coins his machine had produced over the previous month.
So the very first price ever attached to Bitcoin was nothing more than its production cost.
A few months later, in February 2010, Satoshi Nakamoto commented on that method in a reply on the Bitcointalk forum. He described the cost-based estimate as a sensible guess in the absence of a market, and noted that commodity prices tend to drift toward what they cost to make. If the price sits below cost, production slows. If it sits above cost, more people start producing. Then he added the caveat that matters most today: once new issuance became a small share of the total supply, he expected the market price to set the cost of production, rather than the other way round.
Hold on to that idea. It explains everything that follows.
Mining is essentially a lottery run on specialised hardware. Machines around the world churn through trillions of guesses per second, and roughly every ten minutes one of them hits a valid answer and claims the block reward. Since the April 2024 halving that reward has been 3.125 BTC. With about 144 blocks a day, the whole network mints around 450 new coins daily. The cost of winning comes down to two big items, power and machines, with buildings, staff and financing on top.
What makes Bitcoin unusual is the difficulty adjustment. Every 2,016 blocks, or about every two weeks, the network recalibrates how hard the puzzle is so that blocks keep arriving at a steady pace. When more machines join, the puzzle gets harder. When machines switch off, it gets easier, and each remaining miner’s cost per coin falls. The most recent example came on 14 November, when difficulty dropped 9.13%, from about 148.4 trillion to 134.8 trillion, after roughly 100 EH/s of hashrate left the network in early November, according to Bitcoin.com News.
Think of it as a thermostat for the cost of a Bitcoin. Price falls, weak miners unplug, difficulty drops, and the cost of producing the next coin slides lower.
There is a second force hard-coded into the protocol. Every 210,000 blocks, about once every four years, the block reward halves. It started at 50 BTC, fell to 25 in 2012, 12.5 in 2016, 6.25 in 2020 and 3.125 in 2024. Each halving doubles the cost of producing one coin overnight, because the same electricity bill now buys half the reward.
The early years were a story of price pulling cost higher. In May 2010 a programmer famously paid 10,000 BTC for two pizzas, an episode now marked every year as Bitcoin Pizza Day. Bitcoin reached parity with the dollar in early 2011, spiked to around $30 by that June and then collapsed back to low single digits. In November 2013 it broke $1,000 for the first time. Every rally drew in new miners, and difficulty climbed in lockstep behind the price.
Then came the drawdowns, and each one ran the same playbook.
2015. After the collapse of Mt. Gox, once the dominant exchange, Bitcoin slid below $200 in January 2015. Reports at the time put the price under the cost of production. Difficulty had grown around eighteenfold during 2014. For months afterwards it barely moved.
2018. A year after peaking near $20,000, Bitcoin sank to roughly $3,200 in December 2018. Footage of shuttered mining farms circulated widely, and difficulty fell by roughly 29% in about two months. The thermostat did exactly what it was designed to do.
2020. On 12 March 2020, as global markets panicked over the pandemic, Bitcoin plunged toward $4,000 in a single session. For most miners the business turned unprofitable overnight. Two weeks later difficulty fell about 16%. Only two months after that, the May 2020 halving cut the reward in half again, squeezing miners from both directions.
2021. China’s mining ban was the cleanest live test of the mechanism. The country had been home to the majority of global hashrate. Between May and July 2021, difficulty fell by roughly 43%. Blocks came slowly for a few weeks, then the network settled back to its normal rhythm. The miners who stayed simply collected a bigger share of the rewards.
2022. After the FTX exchange imploded in November 2022, Bitcoin fell to about $15,600. On-chain analysts later flagged it as the last time the price traded below average production cost until this year. Anyone who had bought rigs at the top of the cycle was under severe pressure.
The recovery that followed was spectacular. Spot Bitcoin funds opened to everyday investors in January 2024, the fourth halving arrived that April, and in October 2025 Bitcoin pushed to a record above $125,000. Miners raced to plug in more machines and difficulty set its own record, peaking near 156 trillion in November 2025. Higher price, higher cost, exactly as Satoshi described.
Then the tide went out. In February 2026 Bitcoin dropped toward $60,000, and analysts said it was trading below its average production cost for the first time since 2022. Publicly listed miners sold more than 32,000 BTC in the first quarter alone, more than in all four quarters of 2025 combined, according to Cointelegraph. By June, JPMorgan put the all-in production cost at about $78,000 against a price near $62,500, estimating that around one miner in five was losing money.
Here is the detail most commentary missed. When Bitcoin rallied in September, it finally climbed back above JPMorgan’s estimate after 280 days underneath. By then, though, the bank’s cost figure had risen to roughly $85,000. The cost line rose to chase the price. Two months later, with Bitcoin back in the mid-$60,000s, the network is cutting difficulty again to drag the cost line back down.
Miners are adapting in other ways too. Riot Platforms sold 20,264 BTC in the first nine months of 2026, mostly to fund data centre construction, and has signed a 15-year lease for 910 MW of capacity with an AI lab, according to its third-quarter results. Several large operators now see artificial intelligence hosting as a better use of their power contracts than hashing. Transaction fees, meanwhile, have shrunk to a sliver of miner income, well under 1% by several estimates.
Whether Bitcoin is “below cost” right now depends entirely on which costs you count.
If you look at electricity alone, estimates for efficient fleets cluster around the mid-$50,000s to low $60,000s per coin, which means the best operators are still scraping a margin. Riot reported an average cost to mine of $39,265 per coin in its third quarter, excluding depreciation, down from close to $50,000 in the quarter before. Add in hardware wear, buildings, staff and overhead, and the industry-wide figures from JPMorgan land somewhere between $77,000 and $85,000 depending on the month.
Both statements are true at the same time. Bitcoin is profitable for low-cost miners and unprofitable for the industry on a fully loaded basis. That gap is exactly where the pressure shows up: in forced selling, in shuttered rigs, and in falling difficulty.
Satoshi himself compared Bitcoin mining with gold mining, and the comparison is useful precisely because of where it breaks down.
The World Gold Council reports that global average all-in sustaining costs hit a record $1,930 an ounce in the second quarter of 2026, up 22% year on year, and the pace of cost inflation is the fastest in more than a decade. Even so, with gold changing hands below $3,900 in mid-November, the metal still trades at roughly double what it costs to produce. Even at its 2015 low near $1,050, gold stayed above the industry’s average cost.
The reason is the supply response. When gold gets too cheap, high-cost mines close, exploration budgets dry up and less new metal reaches the market. Supply bends to meet the price, and that helps support it.
Bitcoin works the other way round. The code keeps issuing roughly 450 coins a day no matter how many miners quit. Supply does not bend. So the price does not adjust to meet the cost; the cost adjusts to meet the price. That is the core reason the “production cost floor” is weaker for Bitcoin than for gold. It is less a floor than a lagging gauge of miner stress.
None of this makes below-cost episodes meaningless. Look back at 2015, late 2018, March 2020 and late 2022. Each one marked a period of maximum pain for miners, complete with capitulation selling and sharp difficulty cuts, and each one sat in the lower part of its cycle when viewed in hindsight. The cost line did not stop the fall, but extended stretches beneath it have historically coincided with some of the better long-term entry zones.
That fits neatly with the rules-based approach we laid out in The 66% Bitcoin DCA Rule, which only buys when Bitcoin trades at or below two-thirds of its prior all-time high. With the October 2025 peak just above $125,000, that threshold sits a little above $83,000. At around $64,500, Bitcoin is trading at roughly 52% of its record, comfortably inside the buying zone on both measures.
The contrarian caution is that 2026 is not a carbon copy of earlier cycles. Miners now have a credible alternative use for their power in AI hosting, so hashrate that leaves may not come back quickly. Cost estimates themselves keep shifting, which makes them a poor anchor for a price target. And past drawdowns have gone deeper than many expected: the 2018 bear market took Bitcoin more than 80% below its peak. A price below the cost line tells you miners are hurting. It does not tell you the bottom is in.
Bitcoin has fallen below its mining cost again and again, and every time the same thing happened. Miners switched off, difficulty dropped, and the cost line came down to meet the price, just as Satoshi predicted back in 2010. Gold, by contrast, sits comfortably above its cost line because its supply can respond in a way Bitcoin’s cannot.
For investors, the more useful signals are the ones that show the mechanism at work: difficulty adjustments, miner sales and hashrate migration. Watch those, size positions with a rule rather than a hunch, and treat any single Bitcoin mining cost estimate as a moving target rather than a floor. This is not financial advice, but it is a clearer view of what the cost line really means.