Physical Address
304 North Cardinal St.
Dorchester Center, MA 02124
Physical Address
304 North Cardinal St.
Dorchester Center, MA 02124

Bubbles do not announce themselves. They leave residue. Debt piles up somewhere it did not used to live, the people closest to the assets quietly sell, regulators publish careful documents nobody reads, and the price of risk drifts to a level that only makes sense if nothing can go wrong. None of it tells you the date. All of it tells you the terrain.
Bubbles do not announce themselves. They leave residue. Debt piles up somewhere it did not used to live, the people closest to the assets quietly sell, regulators publish careful documents nobody reads, and the price of risk drifts to a level that only makes sense if nothing can go wrong. None of it tells you the date. All of it tells you the terrain.
There is a checklist circulating that formalises this idea. It takes the Nasdaq peak of March 2000 and the S&P 500 peak of October 2007, works backwards, and identifies roughly fourteen conditions that were present in the run up to both. The claim is that thirteen are present today and one is not, and that the missing one was the last to appear in 2007, arriving only a few months before the index rolled over.
Checklists like this deserve suspicion. Anyone can assemble fourteen conditions after the fact and find them again in the present, because markets always contain a dozen things that look ominous in hindsight. But the underlying structure of the argument survives that objection, because most of the items are not vibes. They are numbers with sources, and they are unusually easy to verify right now.
Start with issuance. Every mania needs external funding once internal cash flow stops covering the ambition, and the fuel line is always the same: bond markets. Telecom did this between 1996 and 2001. Mortgage finance did it into 2006 through securitisation vehicles that moved leverage off balance sheets and into structures most investors never examined. The current cycle has both features. Hyperscaler bond issuance has stepped up by an order of magnitude in a year, and a large share of the capital commitment sits in leases, joint ventures, and special purpose structures rather than in the debt line of a balance sheet. The lease disclosures at the largest cloud operators now describe obligations that have not yet started, which is to say obligations that are contractually real and accounting invisible.
Then there is vendor financing, the most reliable tell in any capex boom. When the supplier funds the customer who then buys the supplier’s product, revenue becomes partially self generated. Lucent and Nortel did this openly in the late 1990s. The modern version is more elegant, structured as equity stakes, capacity guarantees, and offtake agreements between chip makers, model labs, and neoclouds, but the economics rhyme. Money leaves the supplier, comes back as demand, and gets recognised as growth.
The fourth countable item is the gap between capital spending and cash generation. In the telecom cycle, spending ran ahead of the revenue it was meant to serve by something like a third. Current estimates put the AI equivalent wider than that. Oracle is the clearest single case: capital spending far in excess of operating cash flow, funded by debt, defended by a backlog of contracted future revenue that depends on counterparties who are themselves burning cash.
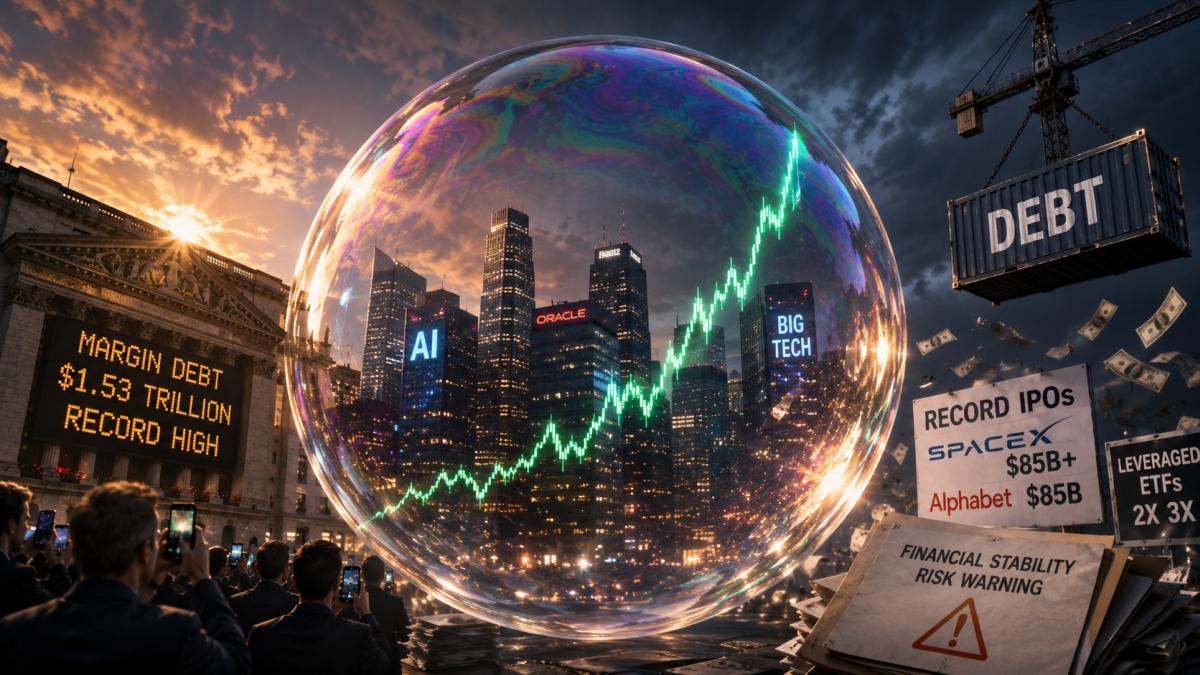
Leverage is the cleanest crowd signal because it is reported monthly and it cannot be spun. Margin debt reached a record $1.53 trillion in June 2026, up 51.5% year over year, with investor credit balances at a record negative $1.06 trillion. That annual growth rate is rare. It has clustered before the 2000 top, before the 2007 top, and before the 2021 top, and almost nowhere else in the series. Growth of that speed matters more than the level, because margin debt is a claim on collateral that must shrink when prices fall, which converts an ordinary correction into a forced one.
Issuance from the equity side is at a matching extreme. US equity issuance hit a record $251 billion in the first half of 2026, driven by Alphabet raising roughly $85 billion to fund its AI expansion and by SpaceX raising $75 billion in the largest IPO ever recorded, later stretched past $85 billion once the greenshoe was exercised. The distinction worth drawing is that 1999 was mania by count, hundreds of small listings with violent first day pops, while 2026 is mania by size. First day pops are modest. The dollar volumes are historically absurd. Both are supply arriving to meet demand at the top of a valuation range, which is what capital markets exist to do.
Add the retail leverage complex, where single stock and single sector products offering two or three times daily exposure now attract record flows into the most volatile part of the index, and the insider picture, where selling at the largest AI beneficiaries has run into billions with essentially no offsetting buying. Insider selling alone is weak evidence, since executives sell for tax and diversification reasons constantly. Insider selling with zero buying across an entire cohort is a different message.
The supervisory community has moved from curiosity to documentation. The Bank of England’s July 2026 Financial Stability Report flags a substantial increase in equity market leverage, describes AI valuations as more stretched, and notes that AI companies are turning to debt financing at an accelerating pace, with the caveat that the risk is currently contained only because the outstanding stock of that debt is still small. That caveat is the whole point. It is a statement that the exposure is growing faster than the buffer.
Regulators are not market timers and their reports are not trading signals. What they are is a record that the vulnerability was legible in advance, which is exactly what the 2006 and 2007 supervisory literature turned out to be.
The most interesting marker on the list is not the loudest one. In late 2006 and early 2007, subprime credit indices collapsed while the S&P 500 continued higher for another seven months. Credit turned first, in one sector, and equity investors treated it as a contained problem.
The modern analogue is visible. Oracle’s five year credit default swap reached roughly 2.03 percentage points in July, the widest on record for data going back to the end of 2008, and the company’s credit risk had already been printing all time highs earlier in the year before an S&P downgrade left it one notch above speculative grade. This is not isolated. Credit spreads at Alphabet, Amazon and Meta have widened as fixed income investors demand more compensation for capex budgets that keep rising, and Oracle’s CDS has become the market’s default proxy for AI debt anxiety.
Alongside that, funding conditions for the buildout have visibly stiffened. Order books on hyperscaler bond deals have thinned, leveraged loans in the neocloud segment have repriced wider, and lenders have started reinstating maintenance covenants that have been largely absent from that market for a decade. Covenants returning is the single most underrated signal in credit. It means the lender has stopped competing for the loan and started underwriting it.
And yet broad credit is asleep. The ICE BofA US High Yield Index option adjusted spread, the premium the entire junk bond universe pays over Treasuries, sits near 2.7 percentage points. Below three. Tighter than 2021. Close to the tightest readings in the history of the series.
Hold those two facts together, because the tension between them is the actual thesis. The riskiest borrower in the AI complex is being priced at record default risk while the aggregate market for risky borrowers is being priced as if default risk barely exists. That is not a contradiction to be resolved by choosing the more comforting number. It is the precise configuration that existed in the first half of 2007, when subprime was already broken and the high yield index was still under 2.5 percentage points. By August 2007 that index had blown through four. The equity peak followed roughly two months later.
In 2000 the sequence ran differently. Credit and equities turned closer together, but credit kept deteriorating through a year in which equity investors repeatedly interpreted each drawdown as a buying opportunity. Either way the warning arrived. It just arrived in a market almost nobody was watching.
Credit is not smarter than equity. It is more constrained. A bond fund has a mandate, a rating floor, and a redemption profile. When the fundamentals deteriorate it is forced to reprice or forced to sell, and the constraint produces honesty faster than opinion does. Equity investors can hold a story indefinitely because equity has no maturity date. Debt matures, and the refinancing conversation is where narratives go to be tested.
That is the case for treating the high yield spread as the confirming variable rather than as one input among many. It is free, published daily, and requires no interpretation. The practical threshold most people use is 3.5 percentage points, with the essential condition that the level must hold. Spreads spike on headlines constantly and mean revert within days. What matters is a widening that refuses to retrace, which is the market signalling that the repricing is structural rather than emotional. Recent history supports the threshold: spreads breached it in February 2020, in early 2022, and again during the 2025 tariff shock, each ahead of significant equity drawdowns.
It cannot tell you when. Most of these conditions were present in 1999 and the Nasdaq roughly doubled before it broke. A checklist that is thirteen fourteenths complete has been thirteen fourteenths complete before, for quarters at a stretch, while short sellers were destroyed. Positioning as though a top is imminent because the conditions for one exist is a different error from ignoring the conditions entirely, and historically it has been the more expensive of the two.
The useful posture is neither exit nor conviction. It is knowing which variable resolves the ambiguity, watching one number instead of fourteen, and having decided in advance what you will do when it moves. Right now the number is near record lows and the market is calm. Thirteen boxes are marked. The fourteenth is a free chart on a central bank website, updated daily, that almost nobody has bookmarked.