304 North Cardinal St. Dorchester Center, MA 02124
Applying Elliott Wave Theory to Cryptocurrency Sentiment Cycles
Elliott Wave Theory has long been a cornerstone of technical analysis, offering a framework to understand market trends and reversals based on collective human behavior. While traditionally applied to stocks and forex, cryptocurrencies bring a unique twist to the theory. With their extreme volatility, emotionally charged market dynamics, and lack of intrinsic valuation, cryptocurrencies provide fertile ground for an unconventional application of Elliott Wave Theory.
Elliott Wave Theory has long been a cornerstone of technical analysis, offering a framework to understand market trends and reversals based on collective human behavior. While traditionally applied to stocks and forex, cryptocurrencies bring a unique twist to the theory. With their extreme volatility, emotionally charged market dynamics, and lack of intrinsic valuation, cryptocurrencies provide fertile ground for an unconventional application of Elliott Wave Theory.
This article explores how Elliott Wave principles can be applied not just to cryptocurrency price charts, but also to sentiment cycles driven by social media trends, on-chain activity, and trading behaviors.
Elliott Wave Basics in a Crypto Context
Elliott Wave Theory proposes that market movements are not random but follow repetitive cycles caused by collective investor psychology. These cycles are broken into impulse waves (five waves moving in the direction of the main trend) and corrective waves (three waves counter to the main trend).
In the cryptocurrency space, these waves often manifest faster and more unpredictably than in traditional markets, due to:
High emotional engagement among investors.
Lack of established valuation metrics.
Influence of social media narratives.
By integrating sentiment analysis and blockchain data, analysts can better understand these unique wave structures.
The Sentiment Dimension: Social Media as a Wave Indicator
Social media platforms like Twitter, Reddit, and Telegram are central to the cryptocurrency community. Sentiment trends on these platforms often mirror the psychological phases of Elliott Waves:
Wave 1 (Ignition)
Sentiment: Early adopters and insiders begin sharing optimism. Mentions of a coin start to rise, but mainstream interest is absent.
Social Media Clues: Low but increasing activity, often from influencers or niche communities.
Wave 2 (Correction)
Sentiment: Skepticism emerges as the price pulls back. Early adopters reaffirm their belief, while others hesitate.
Social Media Clues: Mixed reactions, with some doubting the project’s legitimacy.
Wave 3 (Momentum)
Sentiment: Widespread FOMO (Fear of Missing Out) drives mass participation. Social media mentions explode, and mainstream media begins coverage.
Social Media Clues: Trending hashtags, rapid follower growth for projects, and heightened engagement metrics.
Wave 4 (Consolidation)
Sentiment: Enthusiasm wanes slightly as traders take profits. Skeptics re-emerge, but core supporters remain confident.
Social Media Clues: Reduced activity compared to Wave 3, but consistent support from long-term believers.
Wave 5 (Peak Euphoria)
Sentiment: Unchecked optimism leads to irrational exuberance. Everyone, including retail investors, wants a piece of the action.
Social Media Clues: Overhyped predictions, emotional posts, and frequent mentions of “to the moon.”
By mapping sentiment shifts to these phases, traders can anticipate price movements with greater accuracy.
Tools to Measure Sentiment
1. Social Media Listening Tools
These platforms track mentions, hashtags, and sentiment across social channels:
Hootsuite Insights (Powered by Brandwatch): Offers advanced sentiment analysis with keyword tracking and visual dashboards.
Sprout Social: Provides social listening and audience sentiment analysis to gauge public opinion on your chosen topic.
BuzzSumo: Tracks trending content and sentiment across platforms.
2. Cryptocurrency-Specific Sentiment Tools
LunarCrush: Focused on crypto-specific social media sentiment, it aggregates data on mentions, engagement, and influencers in the cryptocurrency space.
Santiment: Offers real-time data on social sentiment and on-chain metrics, tailored for crypto traders.
Crypto Fear & Greed Index: Provides a daily snapshot of overall market sentiment based on various data sources, including social media.
VADER Sentiment Analysis (Python Library): Ideal for analyzing short-form content like tweets with accuracy.
4. Social Media Platform-Specific Tools
Many platforms provide native analytics tools for sentiment tracking:
Twitter API: Use for detailed analysis of tweets, hashtags, and trends. Tools like Tweepy or NodeXL can extract and analyze data.
Reddit Analytics Tools: Websites like TrackReddit or RedditMetrics help track mentions and sentiment in relevant subreddits (e.g., r/CryptoCurrency).
5. Data Aggregators and Visualization
To synthesize data from multiple sources, use aggregators:
Tableau or Power BI: Combine social media sentiment data with price charts to visualize correlations.
Gephi: Analyze the network and influence of social media mentions.
Best Practices
Define a Clear Scope: Focus on specific assets, hashtags, or influencers to narrow your analysis.
Monitor Sentiment in Real-Time: Cryptocurrency sentiment can shift quickly; use tools like LunarCrush or Santiment for timely insights.
Combine Sentiment with Volume Metrics: A spike in mentions combined with overwhelmingly positive sentiment could signal a Wave 3 rally.
Use Multiple Tools: Combine crypto-specific tools (LunarCrush) with general sentiment tools (Hootsuite) for a holistic view.
By effectively measuring and interpreting sentiment, you can gain a clearer understanding of market psychology and identify critical turning points in Elliott Wave structures.
On-Chain Data as a Complementary Tool
Cryptocurrency markets provide a treasure trove of on-chain data that can validate Elliott Wave patterns. Key metrics to monitor include:
Transaction Volume: Spikes in activity during impulsive waves indicate growing market participation.
Exchange Flows: Large outflows from exchanges during Wave 2 corrections suggest hodlers preparing for Wave 3.
Wallet Activity: Increasing numbers of active wallets during Wave 3 confirm broader adoption.
For example, during Bitcoin’s 2020-2021 bull run, significant outflows from exchanges during corrections aligned with Elliott Wave projections for the next impulsive wave.
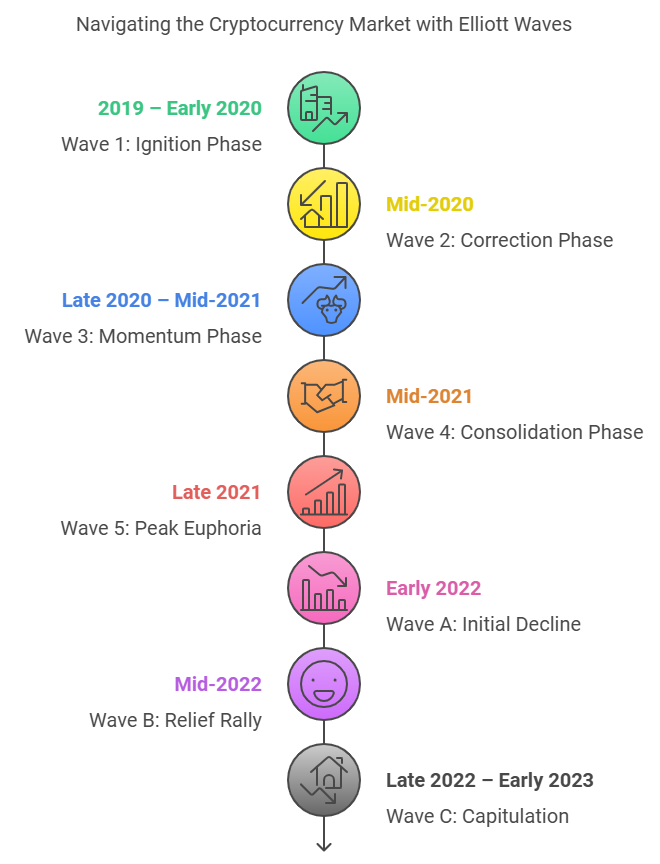
Case Study: Elliott Waves in the Cryptocurrency Market (From Image Analysis)
Using the Elliott Wave chart you provided, we can interpret a complete market cycle based on the principles of Elliott Wave Theory. The cycle demonstrates a five-wave impulsive phase (Waves 1–5) followed by a three-wave corrective structure (A-B-C). This chart, with its labeled phases, provides a clear view of how price and sentiment evolved over time. Below, we analyze each phase in detail, referencing the corresponding dates for clarity.
Impulsive Phase
Wave 1 (Ignition Phase: 2019 – Early 2020)
Description: This wave represents the initial rally in the market, characterized by early adopters and niche investors beginning to buy into the trend. Market sentiment at this stage was still subdued, as awareness and participation remained limited to those closely following the asset.
Price Action: The steady rise in price during Wave 1 reflects early optimism, with gains that set the foundation for the larger trend.
Psychology: Skepticism dominated at this point. Early adopters who recognized the opportunity began to build positions, but public interest and media attention were still minimal.
Observation: This was a phase of quiet accumulation, often referred to as the “smart money” stage.
Wave 2 (Correction Phase: Mid-2020)
Description: After the initial rally, the market experienced its first significant pullback. Wave 2 was marked by profit-taking among early investors and skepticism from broader participants.
Price Action: Prices retraced a portion of Wave 1’s gains but did not fall below the initial low, maintaining the structure of the uptrend.
Psychology: Skepticism re-emerged as some investors questioned whether the rally had run its course. This phase tested the conviction of early adopters who held through the pullback.
Wave 3 (Momentum Phase: Late 2020 – Mid-2021)
Description: The third wave, often the longest and strongest, saw explosive price growth. During this period, mainstream attention surged as retail and institutional investors flocked to the market.
Price Action: The sharp rise in prices during Wave 3 was driven by mass participation and high trading volumes, signaling broad market acceptance.
Psychology: This wave was fueled by FOMO (Fear of Missing Out), with investors scrambling to participate in what appeared to be a once-in-a-lifetime opportunity. Social media mentions, Google search trends, and trading activity all reached unprecedented levels.
Observation: Wave 3 is often referred to as the “public participation” phase, and the euphoria in this wave was evident in both price action and sentiment metrics.
Wave 4 (Consolidation Phase: Mid-2021)
Description: Following the explosive growth of Wave 3, the market entered a period of consolidation. Wave 4 was characterized by reduced volatility and a sideways trend as traders took profits.
Price Action: Prices retraced some of Wave 3’s gains but remained above the peak of Wave 1, preserving the broader bullish structure.
Psychology: Sentiment was mixed during this phase. While some skeptics predicted a larger downturn, long-term believers continued to hold, anticipating the final impulsive wave.
Wave 5 (Peak Euphoria: Late 2021)
Description: Wave 5 marked the final rally in the impulsive phase, driven largely by retail speculation and widespread optimism. This phase often corresponds to “peak euphoria,” where emotional and irrational behavior dominate.
Price Action: Prices reached new all-time highs as retail investors flooded into the market, chasing parabolic gains.
Psychology: Overconfidence led to unrealistic price predictions and widespread belief that the market was in a “new paradigm.” Emotional buying was rampant, creating unsustainable price levels.
Corrective Phase (A-B-C Waves: 2022)
Wave A (Initial Decline: Early 2022)
Description: The corrective phase began with a sharp decline in Wave A, signaling the start of the bearish trend. Early warning signs of market exhaustion became apparent.
Price Action: Prices dropped significantly, causing anxiety among late entrants. The speed and magnitude of the decline surprised many who expected the uptrend to continue.
Psychology: Sentiment shifted dramatically, as fear and doubt replaced the euphoria of Wave 5. Many investors were caught off guard by the severity of the correction.
Wave B (Relief Rally: Mid-2022)
Description: Wave B offered temporary hope to investors, as prices rebounded partially from the Wave A lows. However, this relief rally was ultimately a countertrend move.
Price Action: The upward retracement in Wave B failed to reclaim prior highs, leading to lower levels of confidence.
Psychology: This phase is often marked by false optimism, with many believing the bull market would resume. However, experienced traders recognized this as a classic “dead cat bounce.”
Wave C (Capitulation: Late 2022 – Early 2023)
Description: The final leg of the correction brought prices to new lows, culminating in a capitulation event. Wave C represents the “despair” phase, where pessimism reaches its peak.
Price Action: Prices fell below the lows of Wave A, completing the corrective structure.
Psychology: Panic selling and widespread fear dominated during this phase. Social media sentiment was overwhelmingly negative, and many declared the market “dead.”
Observations
The provided chart aligns closely with the psychological and price patterns outlined in Elliott Wave Theory. Each wave reflects the emotional journey of market participants, moving through optimism, doubt, euphoria, and despair. By identifying these patterns in real time, traders can better navigate the volatility of cryptocurrency markets. For example, recognizing Wave 3’s explosive growth could help investors capitalize on momentum, while identifying Wave C’s capitulation could present an opportunity to accumulate during the market’s lowest point.
This cycle demonstrates the predictive power of Elliott Wave Theory when combined with an understanding of market sentiment and behavior.
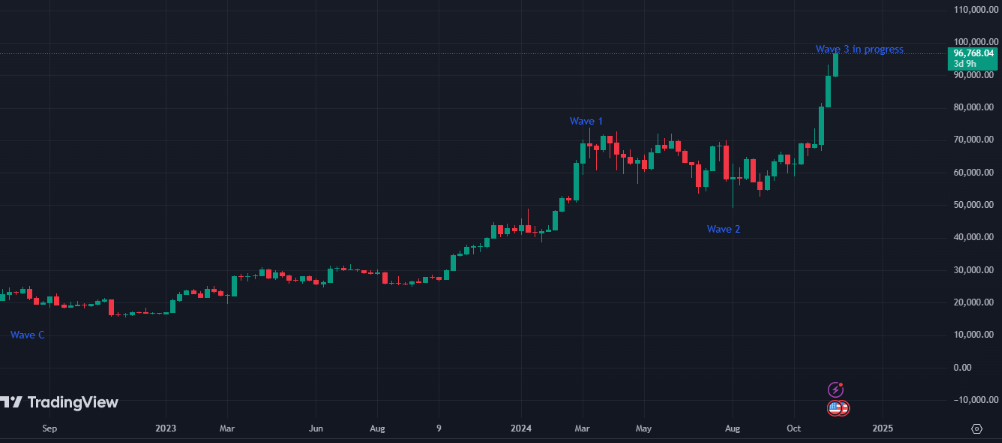
What Happens After the Corrective Wave?
In Elliott Wave Theory, a corrective wave (A-B-C) is typically followed by the next impulsive wave cycle (five waves) if the broader trend remains bullish. After Bitcoin’s bottom in November 2022, there are signs of a new impulsive wave potentially forming.
Wave 1 (Dec 2023 – April 2024): Recovery and Initial Momentum
Description:
After the deep corrective wave bottoming around $15,000 in December 2023, Bitcoin began a gradual recovery, but then climbing steeper to approximately $70,000 by April 2024. This initial wave represented a tentative rebuilding of market confidence following the previous crash.
Psychology:
Cautious Optimism: Investors remained skeptical but saw potential value
Gradual Institutional Re-entry: Measured approach from institutional players
Healing from Previous Downturn: Market slowly regaining trust
Key Indicators:
Steady price appreciation without extreme volatility
Increased institutional interest
Gradual improvement in on-chain metrics
Growing regulatory clarity in various jurisdictions
Wave 2 (April – September 2023): Correction and Consolidation
Description:
A typical corrective wave saw Bitcoin consolidating and pulling back from the $70,000 highs, dipping down to around $48,000, testing the resolve of new investors and shaking out weaker hands.
Psychology:
Renewed Skepticism: Doubts about sustained recovery
Profit-Taking: Early buyers reducing positions
Infrastructure Strengthening: Focus on underlying blockchain technologies
Key Indicators:
Decreased trading volumes
Negative sentiment in crypto media
Potential regulatory challenges
Consolidation of gains from previous wave
Wave 3 (September 2023 onwards): Explosive Growth
Description: Mimicking historical patterns, this wave saw Bitcoin experiencing significant appreciation, potentially touching $100,000. Driven by broader macro-economic factors, institutional adoption, and growing mainstream acceptance.
Psychology:
FOMO Acceleration: Increasing retail and institutional investment
Narrative of Bitcoin as Inflation Hedge: Strengthening global economic uncertainty narratives
Mainstream Financial Integration: More traditional financial products around Bitcoin
Key Indicators:
Surge in Google Trends and social media mentions
Increased ETF flows
Major corporate treasury allocations
Growing global regulatory acceptance
Challenges and Opportunities
Challenges
External Disruptions: Regulatory news or exchange hacks can disrupt wave patterns.
Over-Interpretation: Cryptocurrencies’ high volatility can create false wave signals.
Data Noise: Sentiment data from social media can be misleading due to bots and manipulated narratives.
Opportunities
Real-Time Insights: On-chain data offers instant validation of wave theories.
Psychological Edges: Understanding sentiment dynamics can give traders an advantage over purely technical analysts.
Faster Cycles: Crypto’s speed amplifies the potential for quick profits if wave predictions are accurate.
The Future: Forecasting with Waves
By combining Elliott Wave Theory with sentiment analysis and on-chain metrics, analysts can better navigate cryptocurrency markets. As digital assets become more mainstream, these tools will likely evolve, offering deeper insights into investor behavior.
For example:
A surge in NFT activity could signal an impending Wave 3 for Ethereum.
Growing interest in decentralized finance (DeFi) may trigger new wave structures in altcoins.
Conclusion
Cryptocurrencies’ unique market dynamics present both a challenge and an opportunity for Elliott Wave practitioners. By integrating sentiment analysis, on-chain data, and traditional wave principles, traders can gain a nuanced understanding of price movements in this volatile asset class. As markets evolve, the fusion of these tools will remain essential for navigating the next big crypto cycle.