Physical Address
304 North Cardinal St.
Dorchester Center, MA 02124
Physical Address
304 North Cardinal St.
Dorchester Center, MA 02124


A viral finance video making the rounds this year tells the story of two brothers who invested the same amount of money over the same three years and ended up in wildly different places, one down nearly $5,000, the other up more than $22,000. The hook is effective because it is built on a real and well documented pattern in market history.
A viral finance video making the rounds this year tells the story of two brothers who invested the same amount of money over the same three years and ended up in wildly different places, one down nearly $5,000, the other up more than $22,000. The hook is effective because it is built on a real and well documented pattern in market history. Strip away the dramatic narration and what is left is a genuinely useful framework about how capital behaves during economic collapse, and why a small handful of unglamorous asset classes keep showing up on the winning side of every major crash for the last century.
The instinct is to treat a recession or depression as a leveler, a force that hits every portfolio equally hard. The historical record says otherwise. What actually happens is closer to a transfer than a destruction event. Capital does not vanish during a crash, it moves. Cash loses purchasing power to inflation, equities get repriced downward as earnings expectations collapse, and institutional money that cannot simply sit idle goes looking for somewhere else to go. That somewhere else tends to share three traits: it is physically scarce and cannot be conjured by a printing press, it serves a need that persists regardless of GDP growth, and it has a track record of holding up the last time things fell apart. Four categories keep meeting that description across 1929, 2008, 2020 and 2022, and understanding why is more useful than just knowing the tickers.
Physical gold gets most of the attention, but the leveraged version of that trade sits in the equity of the companies that dig it out of the ground. When a mining company’s production costs stay roughly fixed while the gold price it sells into rises, the extra revenue flows almost entirely to the bottom line, which is why miners tend to move by a larger multiple than bullion itself. The Great Depression is the extreme case study. Between 1929 and January 1933, Homestake Mining, then the largest US gold producer, rose 474 percent, and Dome Mines, the largest Canadian producer, advanced 558 percent, while the Dow Jones Industrial Average lost roughly 73 percent of its value over the same stretch. A detailed breakdown of that period and how it compares to the 2008 and 2020 drawdowns is available through Crescat Capital’s research on the countercyclicality of gold mining stocks, and the mechanics of the Homestake trade specifically are covered well in BullionVault’s analysis of gold mining stocks during deflation.
The honest caveat matters here. These are not buy and forget positions. Homestake’s own dividend policy, which management leaned on heavily during downturns, is documented in this look at Homestake Mining’s history as an outlier in the sector, and even the strongest gold miner runs frequently give back a large chunk of the gain once the crisis phase ends. Miners are a crisis trade with an entry point and an exit point, not a permanent core holding.
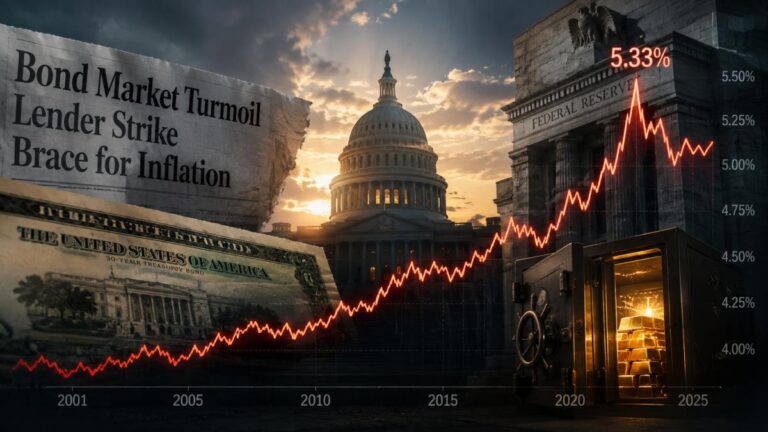
Long dated government bonds are the asset class most likely to be dismissed as dead weight in a portfolio, right up until the month a recession actually bites. The mechanism is flight to quality. When institutional capital needs somewhere considered safe to sit, long Treasuries are one of the few places large enough to absorb it, and as demand pushes bond prices up, yields fall and existing holders see real capital appreciation. During the worst of the 2008 crisis, ETF.com’s review of TLT’s price history notes that the fund was trading near 84 dollars in July 2007 as the crisis began and had risen more than 40 percent by December 2008, while the S&P 500 had fallen roughly 50 percent from its 2007 peak over the same window.
The catch, and it is an important one, is that long Treasuries are a deflation hedge, not an inflation hedge. 2022 proved that the hard way, when persistent inflation and rapid rate hikes sent the same long duration Treasury funds down more than 30 percent in a single year even as stocks were also falling. That is precisely why nobody sensible treats this as a single asset strategy. Bonds protect against one flavor of crisis and can actively hurt during another, which is the argument for holding multiple crisis assets rather than betting the portfolio on one mechanism.
Farmland sits in an unusual position because it does two things most crisis assets cannot combine, it holds a scarcity premium since arable land is not being created faster than it is lost to development, and it throws off actual cash flow through crop rents even if the underlying land value goes nowhere for a stretch. NCREIF’s own farmland index data is the industry benchmark institutional investors use to track this, and the pattern during past downturns is notable precisely because farmland tends not to move with the stock market at all. A breakdown of that decoupling, including the 2008 to 2009 period when equities were falling sharply while farmland returns stayed positive, is covered in FarmTogether’s analysis of farmland’s performance over the past 30 years, and a more academic treatment of how the asset class behaved across the 2001 and 2008 recessions is available through CAIA’s research on farmland during recessions.
Intellectual honesty requires the counterexample too. Farmland was genuinely hurt during the Great Depression itself, with farm income and land values both falling sharply through the Dust Bowl years. The lesson from that period is not that farmland is invincible, it is that the land survived as an asset and transferred to whoever could hold it through the worst years, which is a different and more sobering kind of resilience than a chart that only goes up. <div style=”text-align:center; margin: 2rem 0;”> <iframe width=”560″ height=”315″ src=”https://www.youtube.com/embed/sarU3BZYuOs” title=”4 Assets That Doubled During Every Depression” frameborder=”0″ allowfullscreen></iframe> </div>
The fourth category is the least exciting and arguably the most instructive, because it does not depend on a dramatic surge to work. Companies selling everyday essentials, food, household products, basic beverages, tend to decline less than the broader market during a downturn rather than rising against it. 24/7 Wall St’s coverage of consumer staples ETFs as a recession shield notes that during the 2008 crisis the S&P 500 fell approximately 38 percent peak to trough while the consumer staples sector declined roughly half of that. The reason this matters more than it sounds is pure math. A portfolio down 50 percent needs a 100 percent gain just to break even, while a portfolio down 25 percent only needs a 33 percent gain. Falling less means recovering sooner, and recovering sooner means compounding resumes earlier. A wider survey of which specific sectors tend to hold up, and why, is available through The Motley Fool’s overview of recession resistant stocks.
None of these four assets are secrets. The data on Homestake Mining is public. Treasury bond returns during 2008 sit in Federal Reserve records. NCREIF publishes its farmland index every quarter. Consumer staples performance is tracked by every data provider on the planet. What is actually rare is not the information, it is the discipline to position ahead of a crisis rather than reacting once it has already made the front page, because by the time a recession is obvious to everyone the repricing in these assets has typically already happened. The investors who came through 2008 and 2020 in the best shape were rarely the ones who called the crash. They were the ones who already held a plan that accounted for the possibility of one, sitting alongside their ordinary growth positions rather than replacing them entirely.
This is not an argument for abandoning a standard portfolio or making a dramatic move overnight. It is an argument for recognizing that a standard 60/40 or all equity portfolio is built almost entirely for one type of market, the long slow bull market, and does very little for the 18 to 24 month windows when that market falls 40 or 50 percent. A measured response looks like understanding what each of these four categories actually is, watching the handful of signals that tend to precede a downturn such as yield curve normalization after an inversion, widening credit spreads, and unemployment ticking up from cycle lows, and deciding in advance, calmly, what a modest allocation across gold miners, long Treasuries, farmland exposure and consumer staples would look like in a personal portfolio. The point is not to predict the next crisis. Nobody can do that reliably. The point is to make sure that whenever it arrives, it finds a plan already in place rather than a portfolio built for good times only.