Physical Address
304 North Cardinal St.
Dorchester Center, MA 02124
Physical Address
304 North Cardinal St.
Dorchester Center, MA 02124

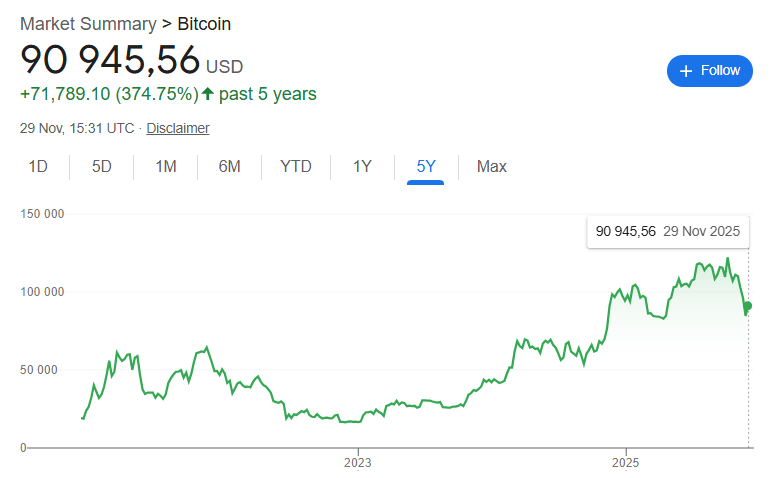
Bitcoin sits at around $97,000 as of late November 2024, having recently surged nearly 40% in a single month following Donald Trump's election victory. For investors wondering whether to jump in or wait, the answer depends heavily on understanding where we are in Bitcoin's four-year market cycle and how current prices stack up against historical patterns.
Bitcoin sits at around $97,000 as of late November 2024, having recently surged nearly 40% in a single month following Donald Trump’s election victory. For investors wondering whether to jump in or wait, the answer depends heavily on understanding where we are in Bitcoin’s four-year market cycle and how current prices stack up against historical patterns.
Bitcoin operates on a remarkably predictable four-year halving cycle that has shaped every major bull and bear market since its inception. This cycle is driven by a programmed event called the “halving,” which occurs roughly every four years or after 210,000 blocks are mined. During a halving, the reward miners receive for validating transactions is cut in half, effectively reducing the rate at which new Bitcoin enters circulation.
[Strategy: See The 66 Percent Rule A Smarter Way to Accumulate Bitcoin]
The most recent halving occurred on April 19, 2024, dropping the block reward from 6.25 BTC to 3.125 BTC. This marked the fourth such event in Bitcoin’s history, following halvings in 2012, 2016, and 2020. Each previous halving has preceded a significant bull market, typically within 12 to 18 months of the event.
The logic behind this pattern is straightforward economics. When supply growth slows while demand remains constant or increases, prices tend to rise. Bitcoin’s design ensures that only 21 million coins will ever exist, with over 19.5 million already in circulation. The halving events accelerate this scarcity, making each remaining Bitcoin theoretically more valuable.
The typical Bitcoin cycle consists of four distinct phases: accumulation (following a bear market bottom), markup (the bull run), distribution (approaching the peak), and markdown (the correction). Historical data suggests we’re currently in the markup phase, approximately seven months post-halving.
Past cycles show a consistent pattern. The 2012 halving was followed by a price increase that peaked about a year later. The 2016 halving preceded the legendary 2017 bull run that took Bitcoin to nearly $20,000. The 2020 halving set the stage for the 2021 rally to $69,000. If history repeats, we should be entering the most explosive phase of price appreciation.
However, each cycle exhibits diminishing returns. While the 2013 cycle saw gains exceeding 5,000% from the previous cycle low, and 2017 saw roughly 2,000%, the 2021 cycle produced approximately 700% gains. Analysts expect this pattern to continue, with projections for this cycle ranging from $150,000 to $310,000 by late 2025, representing more modest but still substantial returns.
Bitcoin’s all-time high of approximately $69,000 was reached in November 2021. At current levels around $97,000, Bitcoin has already exceeded that previous peak by roughly 40%. This represents a notable shift from previous cycles, where Bitcoin typically established new all-time highs much later in the post-halving timeline.
The rapid breach of previous highs can be attributed to several factors unique to this cycle. The approval of spot Bitcoin ETFs in January 2024 created unprecedented institutional access to the asset. These ETFs have absorbed over 1.2 million BTC, removing a significant portion of supply from circulation. Additionally, publicly traded companies like MicroStrategy hold over 870,000 BTC in their treasuries, and sovereign holders account for another 500,000 BTC.
This supply shock creates a different dynamic than previous cycles. When you consider that potentially 20% or more of Bitcoin’s total supply is effectively locked up in long-term holdings, the available supply for trading becomes remarkably thin. This scarcity could drive prices significantly higher than traditional cycle models predict.
Several factors support the argument for entering or adding to Bitcoin positions at current levels. First, we’re only seven months into a cycle that historically lasts 12 to 18 months post-halving before peaking. If traditional patterns hold, the most parabolic price appreciation may still lie ahead, typically occurring in the final six to nine months before a cycle top.
Second, institutional adoption continues to accelerate. Major financial institutions that previously dismissed Bitcoin now offer exposure through ETFs, and corporate treasuries are allocating billions to the asset. This represents a fundamental shift in how traditional finance views Bitcoin, potentially supporting higher valuations than previous cycles achieved.
Third, the macroeconomic environment remains favorable. With governments worldwide running massive deficits and inflation concerns persisting, Bitcoin’s fixed supply becomes increasingly attractive as a hedge against currency debasement. The narrative of “digital gold” has moved from fringe theory to mainstream investment thesis.
Fourth, on-chain metrics suggest room for growth. The MVRV ratio, which compares market cap to realized cap, currently sits around 2.34. Historically, this metric peaks near 4.0 at cycle tops, suggesting significant upside potential remains. Similarly, the percentage of supply in profit and holder behavior indicates we’re not yet in the euphoric distribution phase that marks cycle peaks.
Despite the bullish case, several factors warrant careful consideration. Bitcoin’s 40% surge in November 2024 represents an extremely rapid move that could be followed by a correction. Markets rarely move in straight lines, and pullbacks of 20-30% are common even during bull markets. Investors who buy at current levels should be prepared for volatility.
Additionally, the speed at which Bitcoin reached new all-time highs differs from historical patterns. Previous cycles saw more gradual appreciation, with multiple retests of key levels before continuing higher. The current cycle’s rapid ascent could indicate that some of the expected gains have already been realized, potentially compressing the timeline and limiting future upside.
Regulatory uncertainty also looms larger than in previous cycles. While the Trump administration appears crypto-friendly, global regulatory frameworks remain in flux. Adverse regulatory developments could quickly reverse market sentiment and trigger significant corrections.
Finally, the principle of diminishing returns suggests that even if this cycle follows historical patterns, the percentage gains may be more modest than previous cycles. Investors expecting 10x returns may be disappointed if the cycle peaks around $150,000-200,000 rather than higher projections.
For investors considering Bitcoin exposure, timing strategy becomes crucial. Dollar-cost averaging (DCA) into positions over the coming months may provide better risk-adjusted returns than attempting to time a single entry point. This approach allows investors to build exposure while managing the risk of buying at a local top.
Key indicators to monitor include the MVRV Z-Score, which signals extreme overvaluation when it approaches historical cycle peaks, and the Pi Cycle Top Indicator, which has accurately predicted previous cycle tops within days. These metrics can help identify when the market is approaching euphoric levels that historically precede corrections.
The 200-week moving average also provides context. Bitcoin’s realized price recently crossed above this key level for only the second time in history. The previous occurrence in November 2020 preceded a 212% rally over 90 days. While past performance doesn’t guarantee future results, this signal suggests the bull market may have considerable room to run.
Is now a good time to buy Bitcoin? The answer depends on your investment timeline, risk tolerance, and position sizing. From a cycle perspective, we’re likely in the middle innings of a bull market that could extend into late 2025. Historical patterns suggest significant appreciation potential remains, potentially ranging from 50% to 200% from current levels based on conservative to optimistic cycle models.
However, the rapid price appreciation in November 2024 increases the probability of near-term corrections. Investors with shorter time horizons or lower risk tolerance might consider waiting for a pullback before entering, while those with conviction in the multi-year thesis may view current levels as reasonable entry points within a larger bull market structure.
The key is avoiding the emotional extremes that plague cryptocurrency investors. Buying during periods of maximum euphoria has historically led to poor outcomes, while excessive caution during bull markets means missing substantial gains. The current market shows signs of growing optimism but hasn’t yet reached the manic phase that characterizes cycle tops.
For most investors, a measured approach makes sense. Rather than betting everything on a single entry point, consider building exposure gradually while maintaining strict position sizing relative to overall portfolio risk. Set clear targets for taking profits as the cycle matures, and remain disciplined about rebalancing as Bitcoin’s allocation grows with price appreciation.
The Bitcoin cycle continues to follow a remarkably consistent pattern despite increasing institutional involvement and changing market dynamics. While this cycle may ultimately differ in magnitude or timing from previous ones, the fundamental forces of supply scarcity post-halving combined with growing demand continue to drive the long-term bullish thesis. Whether current prices represent an optimal entry point depends less on perfect timing and more on having a coherent strategy aligned with your financial goals and risk parameters.